The real subject of an integration is the operating model
An acquisition joins two ways of working — two intakes, two decision rights, two proof standards. The deal thesis assumes they combine into one that delivers the synergy. They rarely do on their own: the synergy lives in the seams between the two models, and no integration playbook of migrations and org charts reaches those seams.
This is why a merger can be "integrated" on paper and still fail to create value. Systems merged, teams reorganized, milestones closed — while the operating model that was supposed to produce the synergy was never read, reconciled, or made traceable. The number in the deal model has no governed origin behind it.
The scorecard is green. The value isn't there.
The gap between reported integration progress and actual value creation is not a rounding error — it is the defining failure of the discipline.
of M&A transactions fail to boost shareholder returns — yet most integration scorecards show green across the board in the first 90 days.
of due diligence failed to adequately identify the synergies — acquirers write the check against a number no one validated with the people who must deliver it.
KPMG's diagnosis is the tell: scorecards go green because they measure activity, not outcomes — the CRM migration happened, but no one asked whether the salespeople adopted it; synergy targets were recorded, but realization rates were not. Deloitte's 2025 read echoes it: 47% of executives admit their deals underperformed.
Illustrative synergy bridge: value promised in the deal model erodes at each ungoverned seam between the two operating models — heaviest at Get and Sort, where nobody decided whose model wins. Only the traceable remainder reaches the P&L.
Activity is not outcome
The green scorecard measures activity — migrations done, teams merged, milestones closed. None of it proves the synergy arrived. KPMG's finding is exact: a system migration can be technically complete while adoption sits at 12%, and a board celebrates a synergy target while customer churn quietly compounds. The problem isn't that no one is measuring — it's that they're measuring the wrong things, too late.
- Migration "complete" — adoption at 12%
- Synergy target recorded, realization unknown
- Retention 92% while the finance team quit
- Green at day 90, churn compounding beneath
- The synergy number has no governed origin
- Adoption measured, not migration alone
- Realization rates tracked from day one
- Retention read where the value actually sits
- Leading signals, not lagging green lights
- Every synergy dollar traces to its origin
The winners prove the point from the other side: acquirers who track synergies from day one succeed at 92%. The difference isn't a better thesis or a bigger premium — it's reading the two operating models and holding the synergy to a number that traces to governed work.
GSDPI, applied to an integration
The same five stages that read a single operating model also reconcile two of them — putting the model-work where the synergy actually lives: the seams between the businesses, before the scorecard goes green.
-
G
Get Combined intake
Two businesses have two front doors for demand. Reconcile them into one governed intake — otherwise the merged company runs two operating models wearing one logo, and the synergy has nowhere to form.
-
S
Sort Decision rights
Decide whose rules win — pricing thresholds, approval authority, qualification standards. Cross-functional decision rights can't be reallocated by a function head; this is executive work, and it's where most integrations stall.
-
D
Do Merged execution
A migration is not adoption. Confirm the combined teams actually work the new way — not that the CRM data moved while the real pipeline still lives in someone's spreadsheet.
-
P
Prove Synergy proof
Hold each synergy dollar to a Traceability Ratio — a line from the reported number back to the governed work that produced it. A synergy you can trace is one a board and an investment committee can defend.
-
I
Improve Value capture
Give the integration a single owner with authority across both legacy organizations, and a cadence that reads leading signals — adoption, churn, realization — not the lagging green lights that hide the leak until it's too late.
Where synergy leaks — point by point
What a board experiences as "the deal underperformed" resolves into specific breaks in the seams between the two operating models. The six that carry the most weight:
Two front doors, no governed oneGet
Both businesses keep their own intake for demand, pricing, and commitments. The merged company runs two operating models under one logo — and the synergy that was supposed to form in the overlap has nowhere to actually happen.
Decision rights go unresolvedSort
Whose pricing thresholds, approval limits, and qualification rules win is left ambiguous to avoid conflict. Cross-functional decision rights can't be set by a function head — so they aren't set at all, and the integration stalls in the seams.
Migration mistaken for adoptionDo
The CRM data moved and the systems merged — but the sales team still keeps its "real" pipeline in a spreadsheet. Adoption sits at 12% while the scorecard reads complete. The work never actually changed; only the tooling did.
Synergy reported, never tracedProve
The number in the deal model is asserted in a board deck, not reconciled to governed work. When it's questioned, no one can follow it back to a source — the defining "counted, not proven" failure, now with a nine-figure price tag.
Aggregate metrics hide local crisesProve
Retention at 92% looks fine — until the acquired company's entire finance team left in month two. Churn at 3% masks two accounts worth 18% of acquired revenue. The green average conceals exactly the failures that destroy the deal.
No owner across the two lanesImprove
Integration is run as a checklist with no single owner holding authority across both legacy organizations. The value that lives between them has no one accountable for capturing it — so it quietly leaks while everyone reports their own lane green.
How ETEGY reads it
The synergy doesn't leak because the thesis was wrong. It leaks because two operating models were joined without reading either, and the number was never traced to governed work. We read both models, reconcile them at the seams, and make the synergy provable.
A Zero-Based read of both operating models across the GSDPI lifecycle — reconciling the seams where synergy actually forms — then holding every synergy dollar to a Traceability Ratio so the number traces to governed work, not a board slide. Read the models; prove the synergy. See the Transformation Diagnostic →
The Synergy Traceability Ledger
Turn a synergy target into a ledger you can defend — each dollar mapped to governed work across the GSDPI seams, with the leading signal that says whether it's real. Built to circulate: take it into the deal committee or the board.
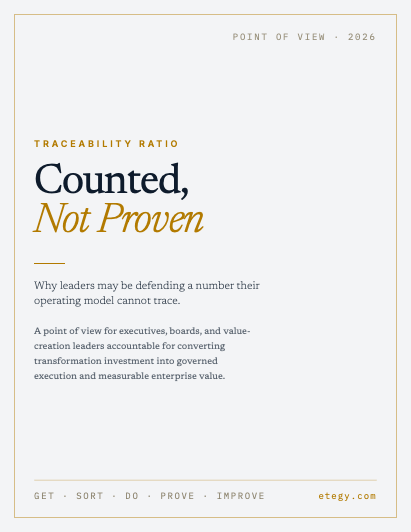
Counted, Not Proven
How synergy gets counted long before it can be traced — and the evidence a board needs to stand behind the number.
Read the paper →